
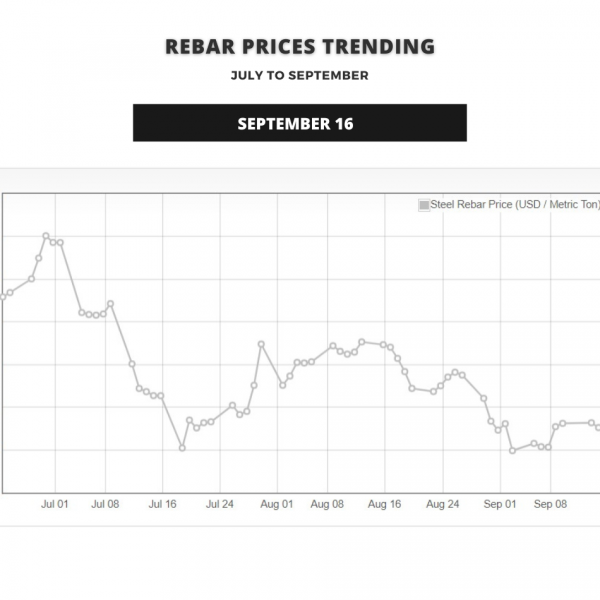
Today, based on the Global Steel Rebar Market, we’re going to review a little chart that shows the average rebar price fluctuations. The Timeline shows a small chart of what happened in 3 months, and from May until today, September 16, the latest ups and downs are shown.
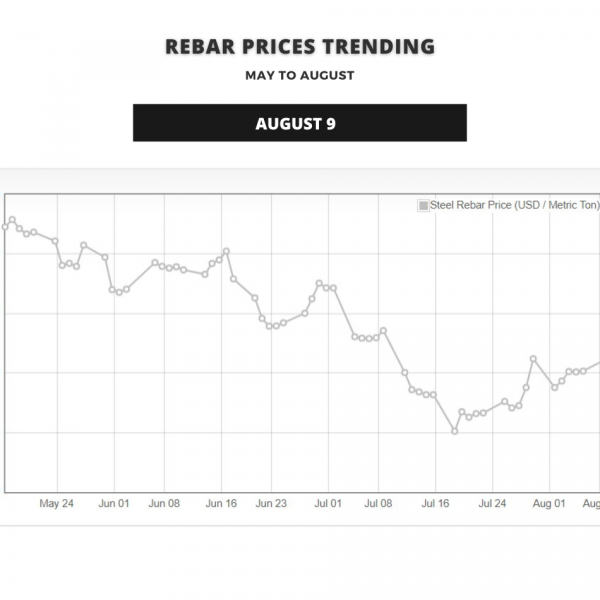
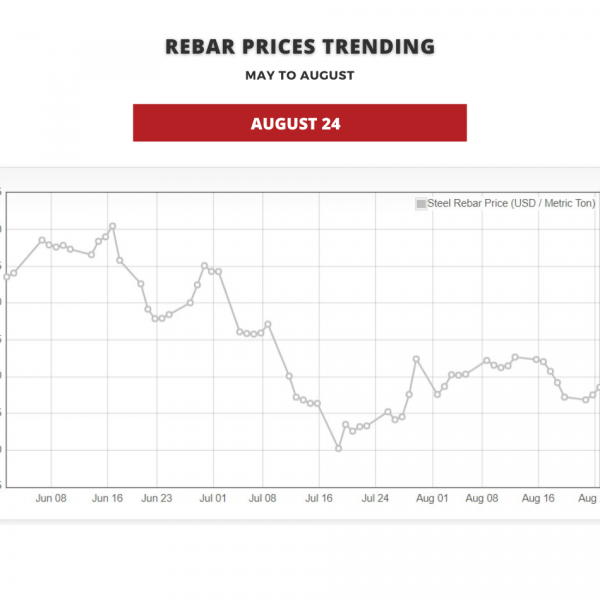
If you look back at the chart from August 24 last month, the price of rebar seems to be going up, but in fact, it has gone down. The lowest price drop in 4 months after May occurred in the first week of September, and the second week shows a slightly up.
The current local rebar price today can be roughly said to have fallen slightly in the last 2/3 days due to the slightly drop in the dollar prices. If you look back at the chart, you can see that the price is heading towards a decrease in the third week of September. Is there a further decrease in the price of rebar in the international rebar market? In this case, how much will the dollar prices would fall? Will the prices of rebar rise once the dollar prices up due to the unstable situation?
The price shown in this chart is in USD. The rebar price fluctuation is based on the Global Steel Rebar Market.
In the current situation, we would like to say a special thank you to each and every customer who are still buying and supporting Millcon Thiha through construction projects and wholesales.
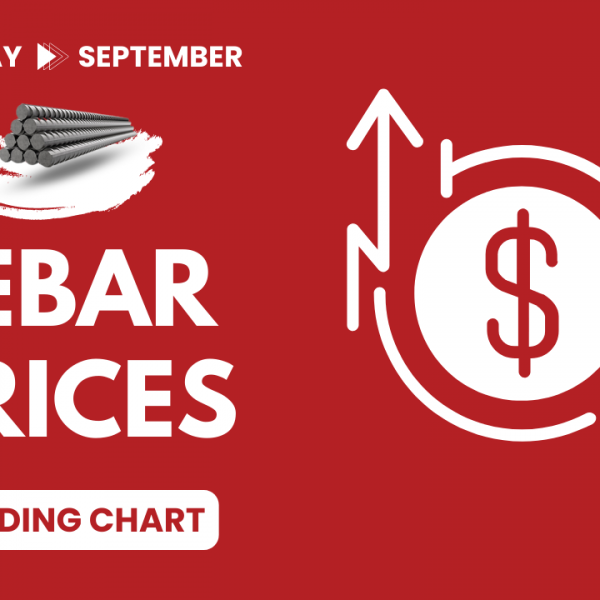
How are rebar prices fluctuating?
Today, based on the Global Steel Rebar Market, we’re going...
Read More
How many types of Rebars?
The compressive strength of concrete is tremendous. Incredible force is...
Read More
What is Galvanizing? History of Galvanizing
In its simplest form, galvanizing refers to the application of...
Read More
How to know if it is Import Original and Local Rebars ?
The real problem with fake rebar is that the businesses...
Read More
Importing Countries & Distribution Areas
Millcon Thiha only distribute high quality steel products importing mainly...
Read More
Our Partner : Millcon Steel
Millcon Thiha is partnering with the companies which focused on...
Read More
We Focus Quality of Authenticity
Millcon Thiha has been supplying high quality steel products in...
Read More